
The 4 places Shopify stores lose sales (and how to fix each one)
Getting visitors but not enough sales? Compare your conversion rate with 427 Shopify stores, then fix the four leaks we find most often.
 Dair Rose Founder, Skynify · 8 min read
 - The median Shopify store turns 1.4% of visits into orders. The top 20% reach 2.6% or more.
- Extra costs are the top reason shoppers abandon checkout: 40% of them, in Baymard's research.
- Start with whichever stage is losing the most money.
On this page+
When a store's growth stalls, the instinct is to spend more on ads. But more traffic into a leaky store just means paying for more people to leave.
After working with 50+ Shopify brands, we see the same four leaks again and again: ads that bring the wrong visitors, product pages that don't close the sale, checkouts that lose people at the last step, and customers who buy once and never come back. Fixing them often does more for revenue than any new campaign.
This guide shows how to check where your store stands, how to find the leak that costs you the most, and what to fix first.
First, see where your store stands
Your conversion rate is the share of visits that end in an order. Littledata tracks it across hundreds of Shopify stores, and in October 2026 the median, across 427 stores, was 1.4%: half the stores converted fewer than 1.4 visits in every 100, and half converted more.
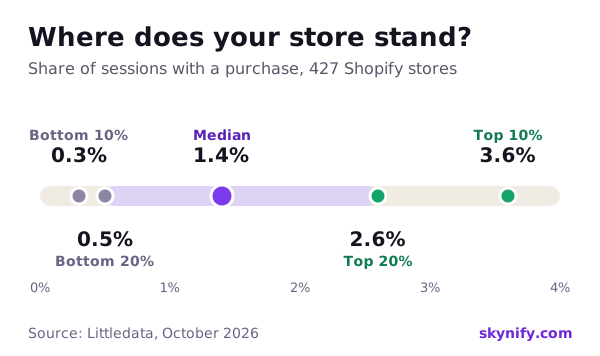
Conversion rate here is the share of sessions that included at least one purchase. Source: Littledata, October 2026.
The gap between stores is bigger than most owners expect. A median store that climbs into the top 20%, from 1.4% to 2.6%, gets almost twice the orders from exactly the same traffic.
Three cautions before you compare:
- What you sell matters. A $3,000 sofa will never convert like a $30 candle, so your own trend over time is a better guide than anyone's average.
- Tools count visits differently, so treat any benchmark as a rough guide rather than a pass mark.
- Shopify changed how it counts sessions on September 21–23, 2026. It now filters out known bots and counts some visits it used to miss, so your conversion rate may have jumped or dropped without a single order changing. Shopify suggests treating the update as your new starting point (Shopify).
A low rate on its own doesn't tell you what's wrong. For that, look at where people drop out. In Shopify, go to Analytics → Reports, filter the category to Behavior and open Conversion rate breakdown. It shows four steps: all sessions, sessions with cart additions, sessions that reached checkout, and sessions that completed checkout. The step with the biggest drop is usually where your biggest leak is.
Leak 1: Ads that bring the wrong visitors
If your campaigns are set up to get cheap clicks, you'll get plenty of them, from people who were never going to buy. Running the same few ads for months makes it worse, because your audience stops noticing them.
The sign that this is your leak: lots of visits from ads, but few of those visitors add anything to their cart. If visitors from ads convert at a fraction of the rate of everyone else, start here.
The fix:
- Optimize for purchases, not clicks. Set campaigns to find buyers, not cheap visits.
- Test new ads every week. Keep what sells and switch off what doesn't. That's how we kept Amourprints' Meta ads returning 5.5× for twelve months straight.
- Send each ad to the page that matches its promise. Someone who clicked an ad about one product or benefit should land on exactly that, not on your homepage.
And if your ads report a great ROAS but the store still isn't making money, read why a great ROAS can still lose money.
Leak 2: Product pages that don't close the sale
Someone clicks an ad about a specific benefit, lands on a product page that talks about something else, and leaves. Slow pages and an offer buried far down make it worse.
Most of your visitors are probably on a phone, so check every important product page on one. Before the first scroll, a shopper should see:
- What the product is and what it does for them, in words that match the ad.
- The price, the offer and the add-to-cart button.
- A star rating and the number of reviews.
- Real photos, including the product in use and something that shows its size.
Further down, answer the questions that stop people buying, right on the page:
- What will it cost to get it? Shipping costs and the delivery date, close to the price.
- What if it's not right? Your returns policy, in plain words.
- Will it work for me? Sizes, dimensions, materials, and reviews from people like them.
Then test the page's speed on a phone with Google's free PageSpeed Insights. Many apps add code to every page of your store, so remove the ones you no longer use.
For Soul Comfort, redesigning the landing pages so each one matched what the ad promised was part of what took monthly revenue from $21K to $105K in four months.
Leak 3: Checkouts that lose people at the last step
About 70% of online shopping carts are abandoned, according to the Baymard Institute's average of 50 studies. Plenty of those shoppers were just browsing. But when Baymard asked US shoppers why they left a checkout, and set the browsers aside, the top reasons were things a store can fix:
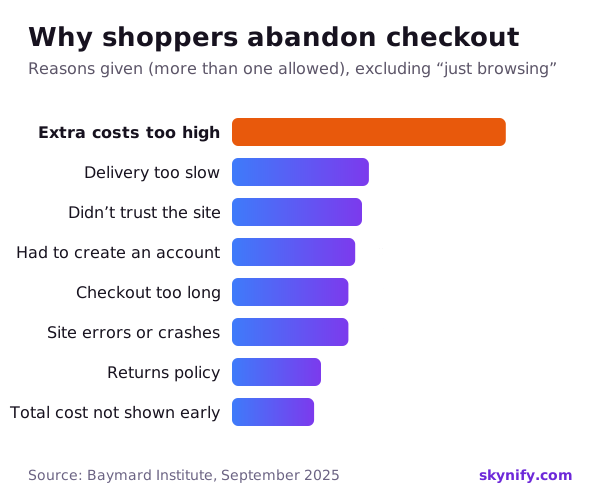
Shoppers could give more than one reason. "Just browsing", given by 42% of US online shoppers, is left out. Source: Baymard Institute, last updated September 2025.
Here's how each reason turns into a fix:
| Why they left | What to do |
|---|---|
| Extra costs too high (40%), or couldn't see the total up front (12%) | Show shipping costs on the product page and in the cart, or build shipping into the price. A free-shipping threshold with a progress bar in the cart helps too. |
| Delivery too slow (20%) | Show an estimated delivery date near the add-to-cart button, and offer a faster option at checkout. |
| Didn't trust the site with their card (19%) | Reviews, a clear returns policy, real contact details, and payment options people recognize. |
| Had to create an account (18%) | Let people check out as guests. Shopify allows it by default, but check your customer account settings. |
| Checkout too long or complicated (17%) | Offer express checkout, like Shop Pay, Apple Pay, Google Pay and PayPal, so shoppers can skip the forms. |
| Site errors or crashes (17%) | Place a test order on a phone every month, with a discount code, and again after installing any new app. |
| Returns policy (13%) | Make returns simple, and say so before checkout, not only in the footer. |
Further down Baymard's list, 10% left because their card was declined and 9% because there weren't enough ways to pay. Offering the payment methods your customers expect, including pay-later options for bigger orders, helps with both.
The prize is real: Baymard estimates the average large online store could raise its conversion rate by 35% through better checkout design alone.
Even with all of that fixed, some shoppers will still leave. That's what an abandoned cart email and text, sent within the first hour, are for. See the 5 email flows every Shopify store should have running, and use our abandoned cart calculator to see what reminders could win back for your store.
Leak 4: Customers who buy once and disappear
If there's no follow-up after the first order, most customers won't come back on their own. That means you keep paying for ads to reach people who already know and like your brand.
Check your returning customer rate in Shopify's analytics. Then put the basics in place:
- A post-purchase series that helps people use what they bought and asks for a review.
- A win-back email for customers who are past their usual time between orders.
- A reason to reorder: a refill, a bundle, a new collection, or early access for existing customers.
Every repeat order is one you didn't have to pay an ad platform for. Our customer lifetime value calculator shows what a customer is worth to you over time, and how much you can afford to pay to win one.
What fixing a leak is worth
Here's the example store from our conversion rate calculator: 20,000 visits a month, 1.5% of them buy, at $100 an order, with 41.8% of each order left after costs. That's 300 orders and $12,540 in profit before ads.
Raise the conversion rate to 2% and the same visits bring in 400 orders: 100 more orders, $10,000 more revenue and $4,180 more profit, with no extra ad spend. Buying the same 100 orders with ads at a 3× ROAS would cost about $3,333, leaving only $847 of that profit.
That's why fixing the leaks usually comes before raising the ad budget. And when you change something, our A/B test calculator tells you whether the result is real or just noise.
Where to start
Start with whichever stage is losing the most money. For most stores doing $10K–$100K a month, that's the product page or the abandoned cart. Above that, it's usually repeat purchases.
A 30-minute check you can do today:
- Find your conversion rate in Shopify's analytics and compare it with the benchmarks above.
- Open the conversion rate breakdown and note the step with the biggest drop.
- Open your three best-selling product pages on your phone. Can you see the price, the offer, the reviews and the add-to-cart button without scrolling?
- Place a test order on your phone, start to finish, and note every surprise.
- Check that your abandoned cart email is live, and when it sends.
- Find your returning customer rate.
Fix all four, and the same ad budget brings in noticeably more sales.
If you'd like help finding your biggest leak, that's exactly what our strategy calls are for.
Questions and answers
Usually one of four leaks: ads that bring the wrong visitors, product pages that don't answer shoppers' questions, a checkout that surprises people with extra costs or steps, or no follow-up after the first order. Shopify's conversion rate breakdown report shows which step loses the most people.
Go to Analytics, then Reports, filter the category to Behavior and open Conversion rate breakdown. It shows all sessions, sessions with cart additions, sessions that reached checkout and sessions that completed checkout.
In the Baymard Institute's research, leaving out people who were just browsing, the top reason is extra costs such as shipping, taxes and fees (40%), followed by slow delivery (20%), not trusting the site with card details (19%) and being made to create an account (18%).
Yes. When Vodafone tested a faster version of a landing page, the version that showed its main content 31% sooner made 8% more sales. Shopify's web performance report shows how fast your store is for real visitors.
Yes. Unexpected extra costs are the top reason shoppers abandon checkout, so show shipping costs, or your free-shipping threshold, on the product page and in the cart, along with an estimated delivery date.

Founder of Skynify. Nine years in e-commerce and 50+ Shopify brands scaled, from first-time founders to Tuff Crowd.